Abstract: Greenhouse gas (GHG) emissions from reservoirs have most often been evaluated on a global extent through areal scaling or linear-regression models. These models typically rely on a limited number of characteristics such as age, size, and average temperature to estimate per reservoir or areal flux. Such approaches may not be sufficient for describing conditions at all types of reservoirs. Emissions from hydropower reservoirs have received increasing attention as industry and policy makers seek to better understand the role of hydropower in sustainable energy solutions. In the United States (US), hydropower reservoirs span a wide range of climate regions and have diverse design and operational characteristics compared to those most heavily represented in model literature (i.e., large, tropical reservoirs). It is not clear whether estimates based on measurements and modeling of other subsets of reservoirs describe the diverse types of hydropower reservoirs in the US. We applied the Greenhouse Gas from Reservoirs (G‐res) emissions model to 28 hydropower reservoirs located in a variety of ecological, hydrological, and climate settings that represent the range of sizes and types of facilities within the US hydropower fleet. The dominant pathways for resulting GHG emissions estimates in the case-study reservoirs were diffusion of carbon dioxide, followed by methane ebullition. Among these case-study reservoirs, total post-impoundment areal flux of carbon ranges from 84 to 767 mgCm−2d−1, which is less variable than what has been reported through measurements at other US and global reservoirs. The net GHG reservoir footprint was less variable and towards the lower end of the range observed from modeling larger global reservoirs, with a range of 138 to 1,052 g CO2 eq m−2 y−1, while the global study reported a range of 115 to 145,472 g CO2 eq m−2 y−1. High variation in emissions normalized with respect to area and generation highlights the need to be cautious when using area or generation in predicting or communicating emissions footprints for reservoirs relative to those of other energy sources, especially given that many of the hydropower reservoirs in the US serve multiple purposes beyond power generation.
Authors: Carly Hansen, Rachel Pilla, Paul Matson, Bailey Skinner, Natalie Griffiths, and Henriette Jager
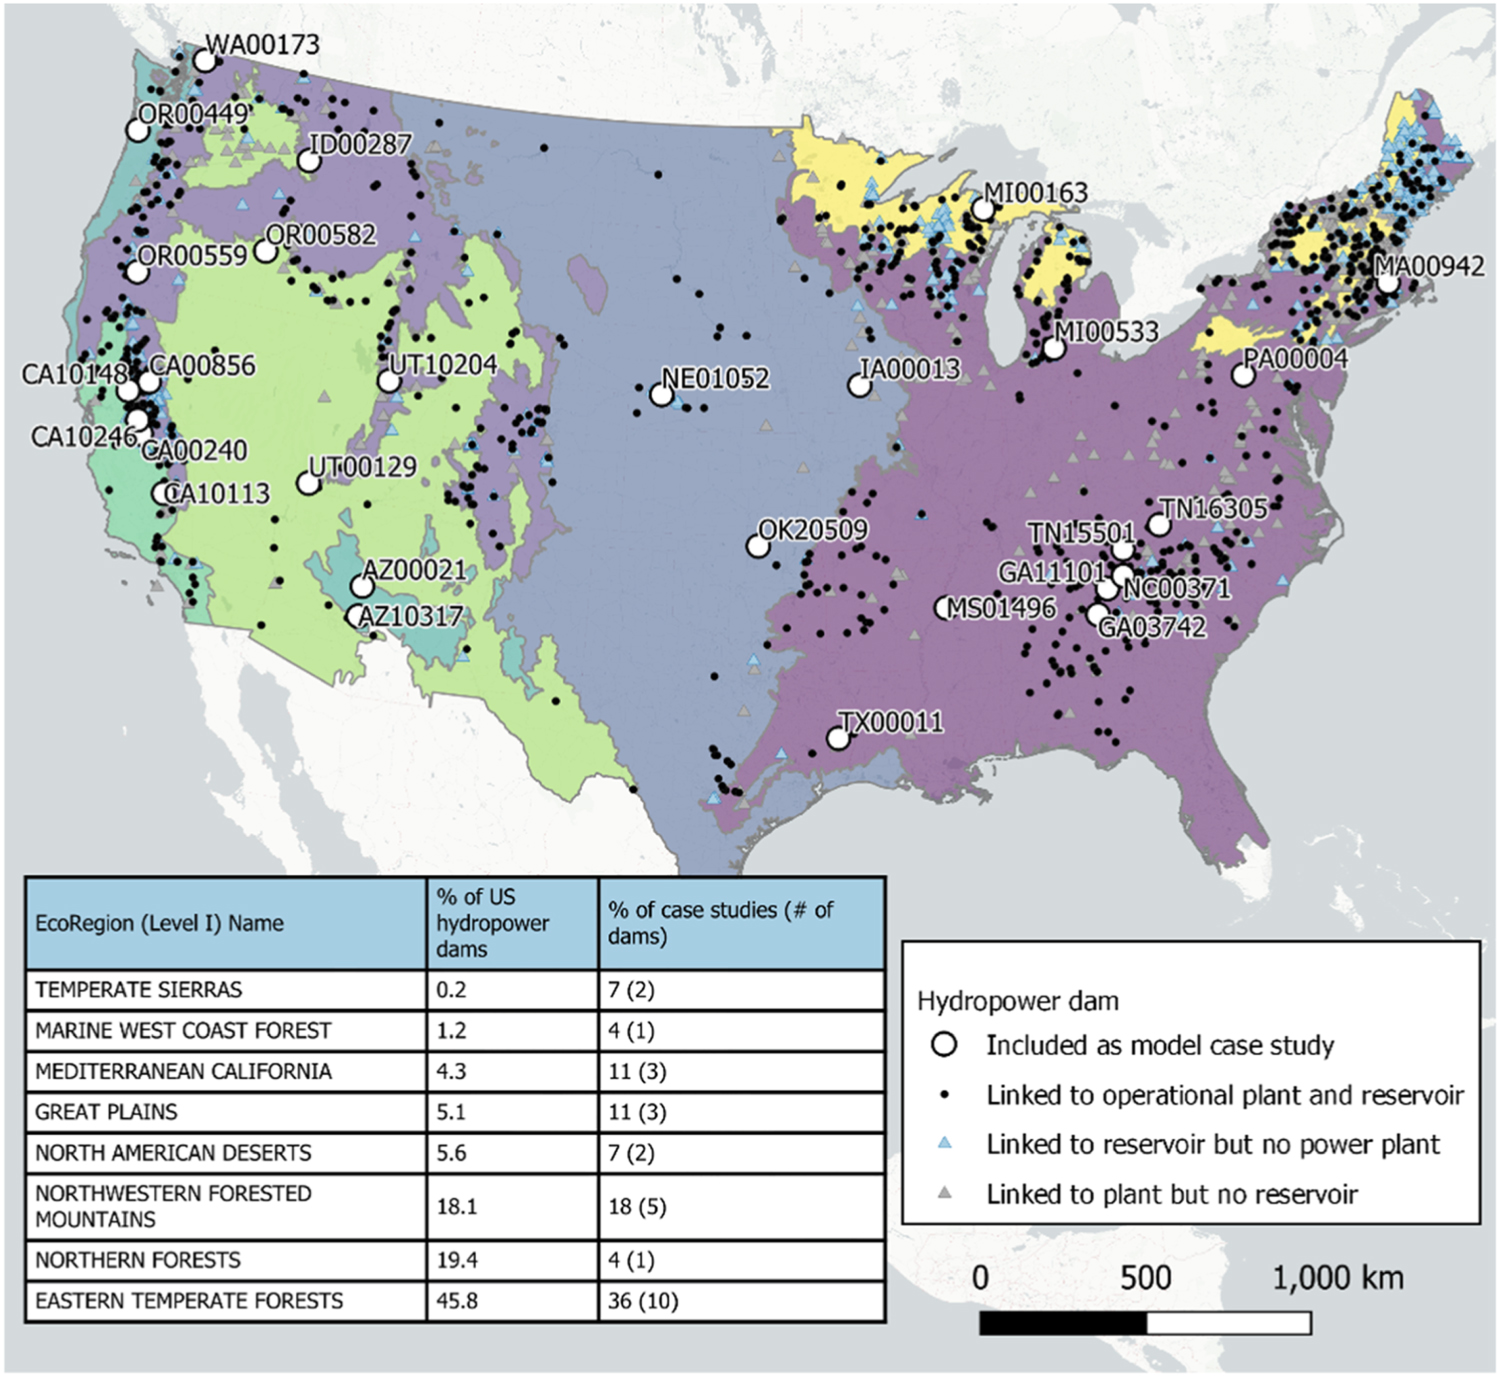
Figure 1. Locations of hydropower reservoirs and those selected as case-studies for G-res model application in this study. Identifiers shown for reservoirs correspond with those used in the National Inventory of Dams (USACE 2019).